
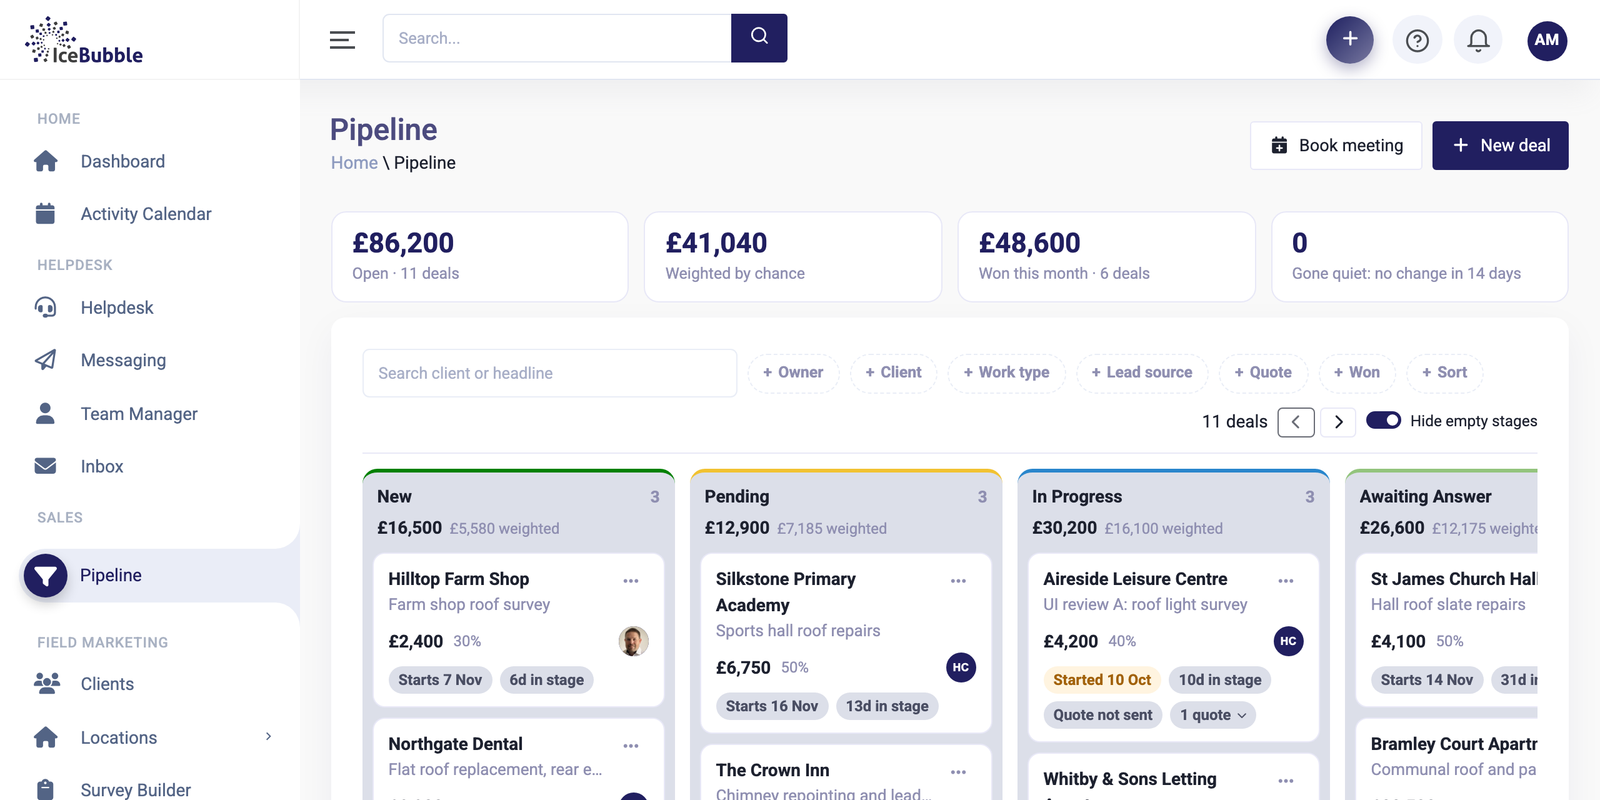
Sales pipeline
Deals as cards by stage, quotes and deposits from the deal, and won work that turns into jobs.
More on sales pipelineIceBubble CRM
Build your own reports and dashboards from blocks, and start each day with a plain English summary of what needs your attention.
The monthly report is built by hand from three exports. The dashboard is green while nothing moves, and you find out a big deal has stalled when it is already lost.
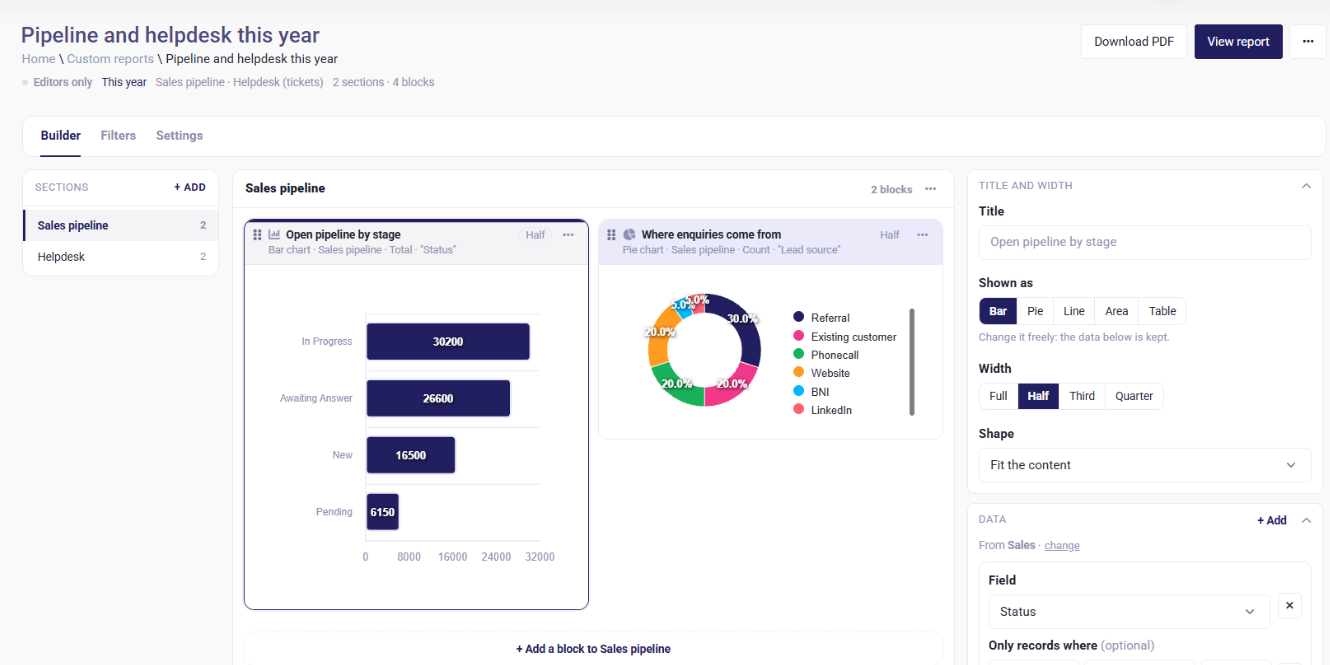
In IceBubble CRM you build the reports you want from blocks, and an AI summary each morning points out the numbers that need you today.
Lay out sections and drop in charts and tables, such as open pipeline by stage, where enquiries come from, tickets by status or tickets by category. Choose bar, pie, line or area charts, tables, galleries and maps.
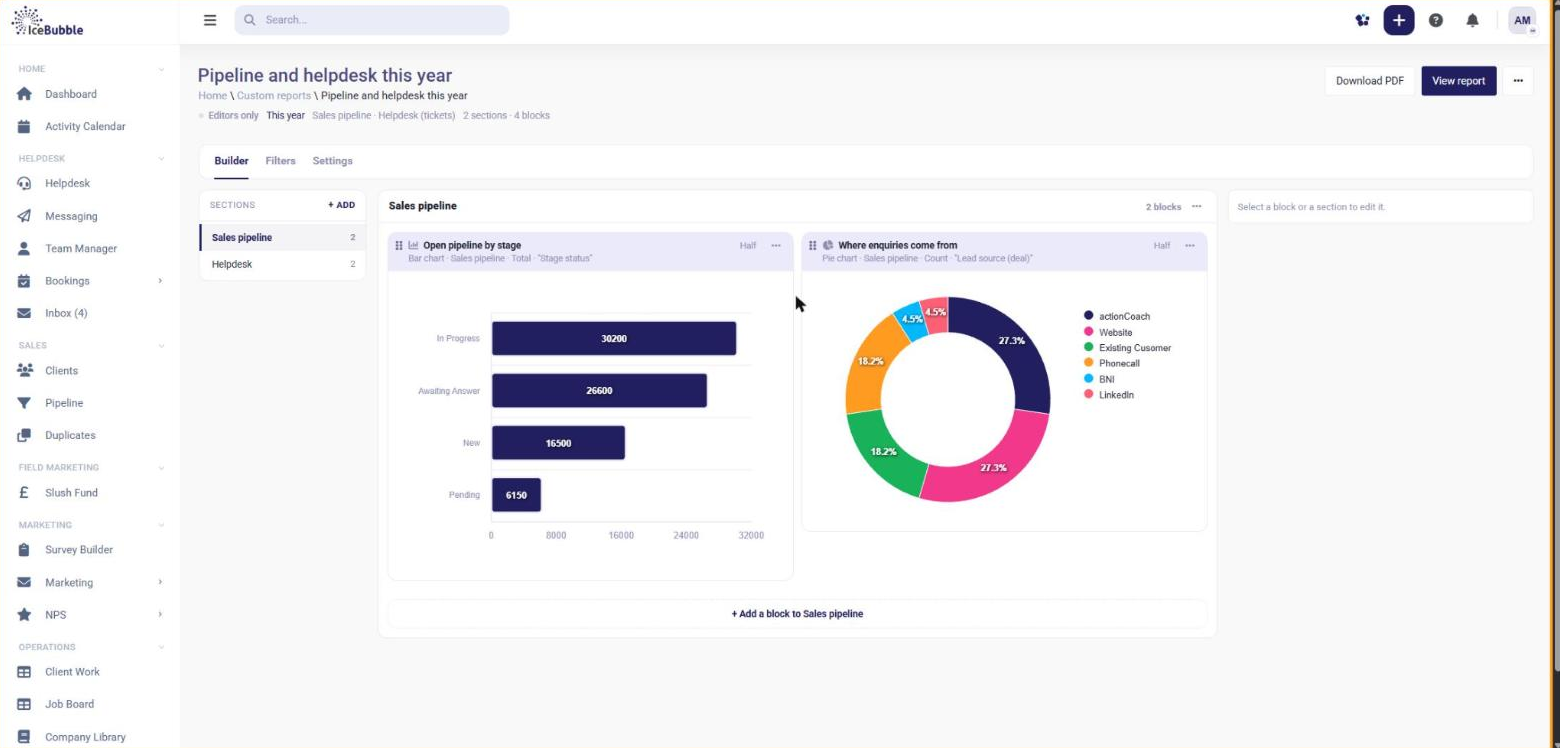
Before you open anything, the AI summary has read your pipeline, your helpdesk queue and your operations, and written up what needs your attention. So rather than "5 deals on hold", it tells you that £75,000 has had no activity for two weeks and someone should call today.
Pick Direct for the facts, plainly stated, or Cynic if you want some commentary with them.
An API and an MCP connection let assistants such as Claude read and update the CRM, within the permissions you set. Ask which deals have gone quiet or which projects are at risk, and get the answer from your own data.
Reports can use anything in the CRM: pipeline, jobs, delivery plans, helpdesk, campaigns, surveys and absence. It is all one database, so nothing has to be exported and stitched together.
Deals as cards by stage, quotes and deposits from the deal, and won work that turns into jobs.
More on sales pipeline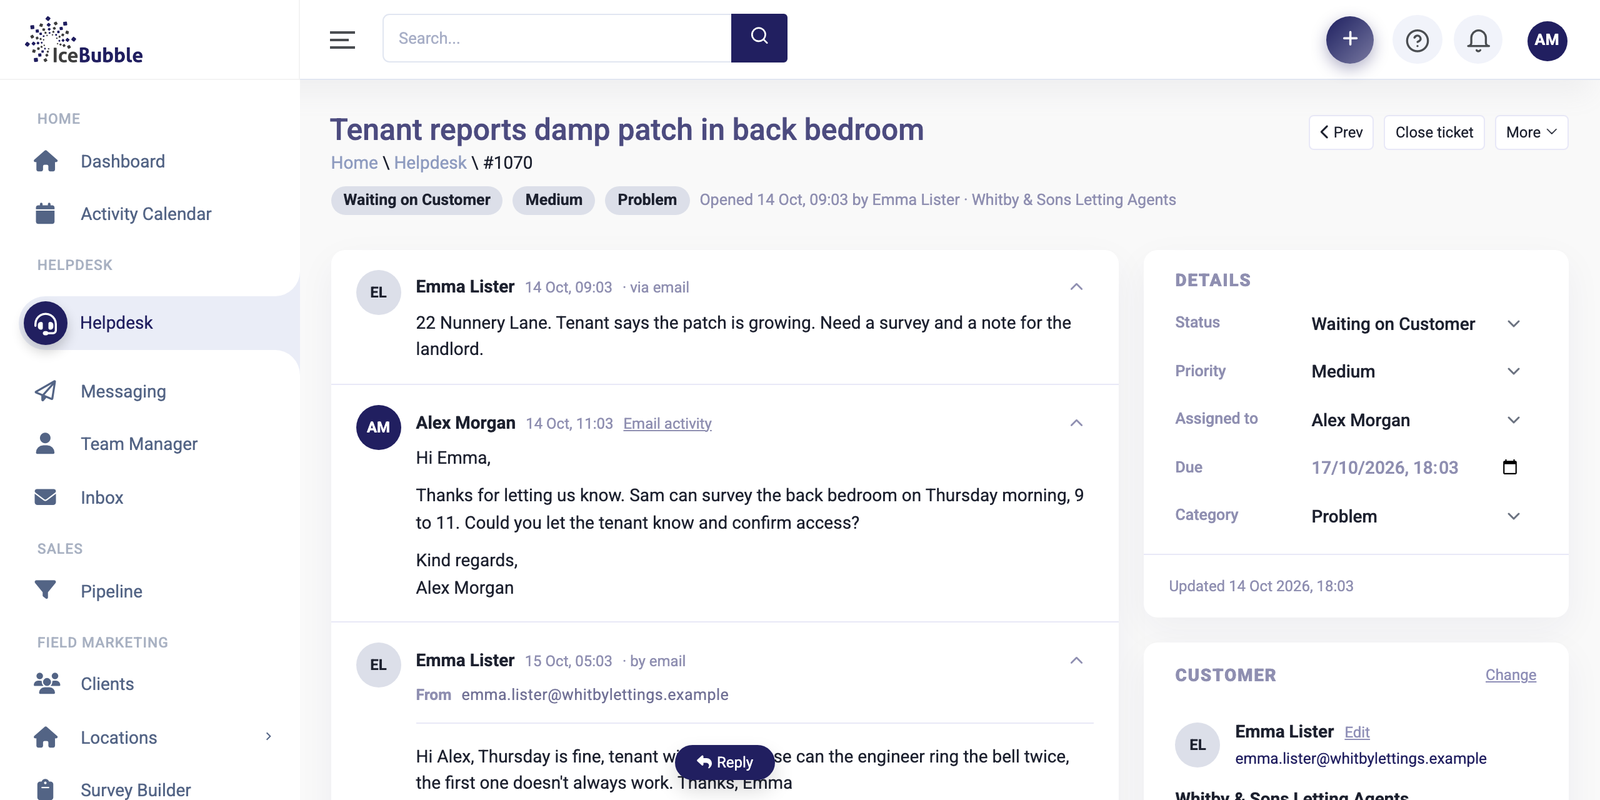
Customer emails land as tickets, attached to the right client and job, with notes and replies in one thread.
More on helpdesk and inbound email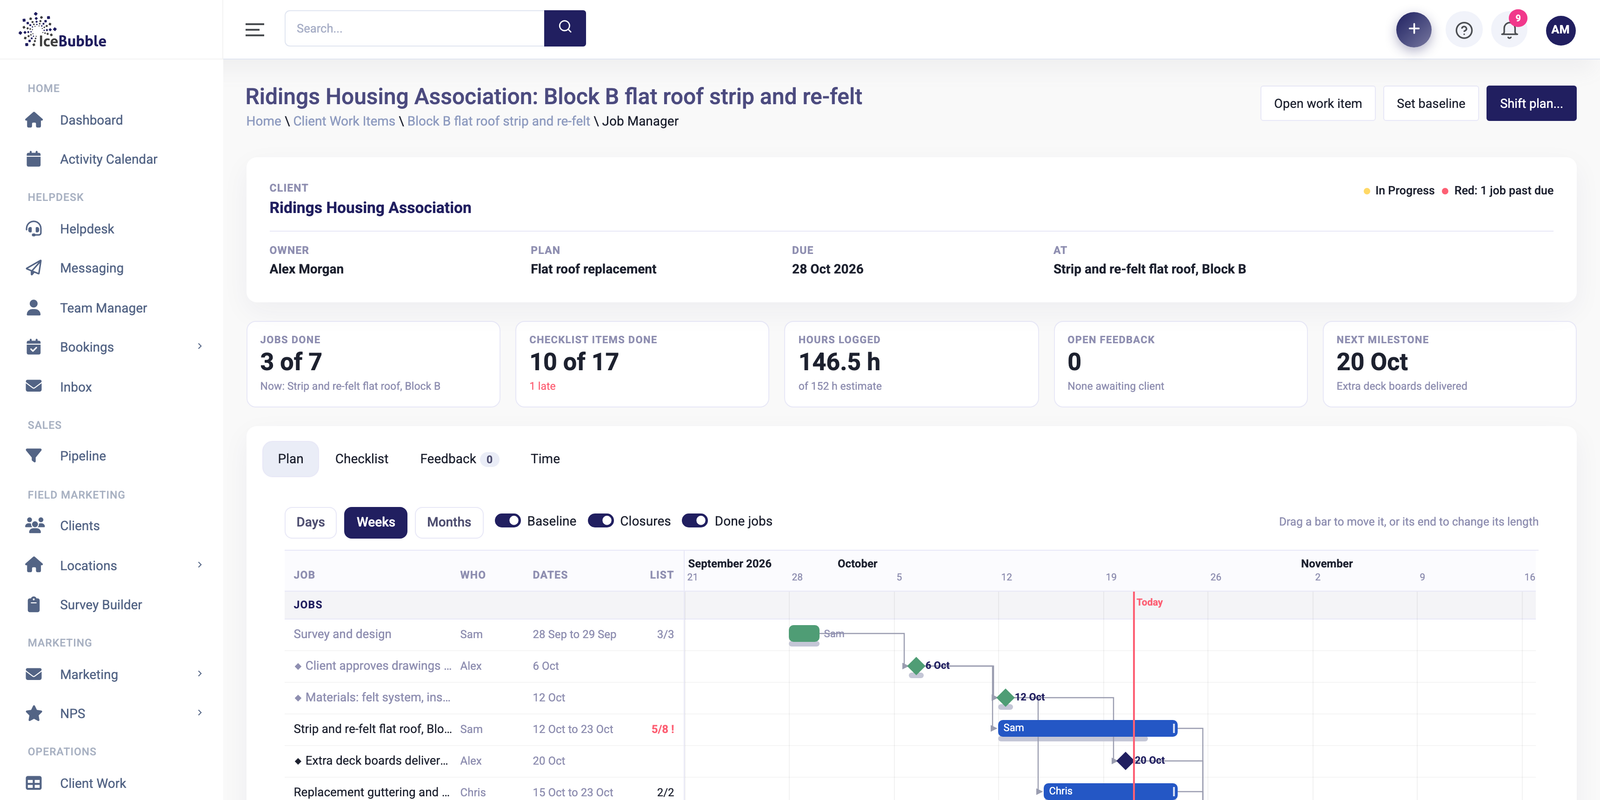
Win the deal and the plan builds itself, with every job on one Gantt and the knock-on of any change shown first.
More on delivery managementYes. Lay out sections and add charts and tables from any part of the CRM.
Sales (pipeline health, stalled deals, new prospects, quotes outstanding) and operations (helpdesk tickets, overdue items, what needs attention today).
Summaries are built from your CRM data for your team. Talk to us about how AI is used and what is sent where.
We'll show you the CRM using work like yours, and answer whatever you want to ask.
Prefer not to book online? Call 07766 120568 or email hello@icebubble.co.uk.